Thursday, February 7, 2013

"Value Creation" Quadrant based Analysis of Top 5 Indian IT firms

The recently concluded World Economic Forum conference at Davos which was attended by luminaries from all over the globe had an interesting theme for this year namely “Resilient Dynamism”. This has been arrived at based on the balance needed between the two counter forces in the world economy: viz. ‘Agility and Dynamism’ needed to grab the huge transformational opportunities that exist AND ‘risk resilience’ which is needed in the wake of the imminent risks emanating from the problems ailing the economies in different parts of the world.

There is an increased probability of “Black Swan” events happening in future and the two main reasons for this unpredictability and foggy vision are ‘mounting debts and fiscal deficits in several economies’ and ‘lack of inclusive growth’. The Indian IT firms which are epitomes of corporate governance and modern management practices have to support the cause of inclusive and sustainable growth failing which the long term survival of the organizations will be in question. What is important is not only maximization of value creation to the shareholders but also making an impact on the society and environment at large. The WEF theme of “Resilient Dynamism” is very relevant to the Indian IT firms as well.

The Feb 2013 issue of HBR has an interesting article on the “Top 100 CEOs for 2012” which ranked the CEOs of 3000 global companies on the basis of the performance of their respective firms during their tenure as the CEO. Surprisingly none of the CEOs of the Indian IT firms figure in this list. The ranking was done based on the net value creation done by the respective firms, which was measured by the delta change in the market capitalization of the firm during the tenure of a CEO (after adjusting for industry and country specific fluctuations). This goes to show that while the Indian IT industry was much appreciated for its transformation of the Indian economy and for bringing India onto the global radar, none of these firms created extraordinary returns for their shareholders in the period under consideration. The CEOs of other Indian firms like ITC, ONGC, Reliance, Airtel and L&T figure in the HBR Top 100 CEO list for 2012.

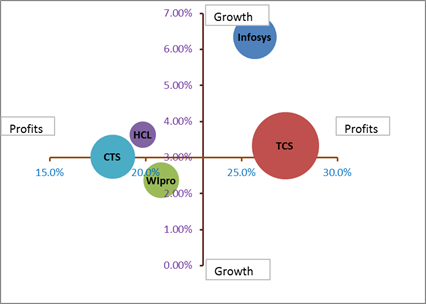
In the ‘Value Creation’ Quadrant below, I have attempted to classify the Top 5 Indian IT firms on two axes, viz. Profitability (operating profits as a % of revenues) and Growth (QoQ growth for the current quarter) and the scenario looks as follows:

1.       HIGH PROFITS and HIGH GROWTH: Infosys
2.       HIGH PROFITS and MODERATE GROWTH: TCS
3.       LOW PROFITS and MODERATE GROWTH: Cognizant
4.       LOW PROFITS and MODERATE GROWTH: HCL
5.       LOW PROFITS and LOW GROWTH: Wipro

The bubble scatter of the Top 5 Indian IT firms on the twin axes of Profitability and Growth is as follows with the ‘size of the bubble’ being an indicator of Quarter revenues:

Value Creation Quadrant for Q3, FY13


Value Creation Quadrant for Q2, FY13


Like I mentioned in my last quarter’s analysis report when comparing the Top 5 IT firms, we need to lay specific emphasis on the “net value creation” to the shareholders in dollar terms and not worry too much about the growth rate or the profitability % in isolation. The market however does not just look at the cumulative value creation to shareholders at a point in time or the total value creation in a quarter. The market value is based on the net present value of the anticipated future value creation to the shareholders over a longer time horizon which is function of both the growth rate and profitability. The market typically assumes that the companies with rapid growth rates are expected to create more value over a longer time horizon and hence place a premium on these firms. However if such rapidly growing firms show even minor drop in the growth rate the impact on their market valuation is very steep. Apple is a classic case in point whose market valuation crashed as it could not convince the markets of continuity in its growth rates despite a record growth of 18% QoQ in the current quarter and consistently good performances in the preceding quarters as well.

From the above perspective let me attempt to give my point of view on how the potential value creation in absolute dollar terms for these firms might look like in future.

While TCS is much lower in the quadrant in terms of growth, its profitability is slightly higher than Infosys and it also ranks first in terms of the absolute operating profits as its revenue base is large. TCS has moved down in the quadrant over the previous quarter. TCS will however be probably ahead of Infosys in terms of sustainable value creation in the long run assuming the current growth and profitability rates to remain as they are. 

Infosys is in the Top Quadrant and has the highest growth rate and the second highest profitability. It has improved its position substantially from the last quarter’s quadrant. If it can maintain its profitability at these levels or even if its growth tapers to the level of TCS in the coming quarters it is still poised to create a very good value in the long run. It is ranked second in terms of absolute operating profits in dollar terms in the current quarter.

Cognizant has a low margin and its operating profit in absolute terms is much lower and unless it performs consistently at highest levels of growth in the industry the overall value creation will be much lower than that of TCS and Infosys. Also there will be significant fluctuations in its market value when its growth rate decreases as its profitability is low.  Cognizant has moved down significantly in its quadrant position compared to its position in the last quarter.

HCL will come next in terms of the long term value creation based on its current performance and its position in the quadrant has almost remained constant.

Wipro might be the last in term of long term value creation despite its moving up the quadrant by a notch over the last quarter unless its growth rate improves and becomes more predictable. However in terms of the net value creation in absolute dollar terms it remains ahead of HCL in the current quarter.

For more detailed Financial Performance Analysis for this quarter please click here

Please feel free to send in your valuable feedback/comments on my analysis…

Comparative Analysis of Top 5 Indian IT firms for Q3, FY13 -- With COGNIZANT Updates

The Cognizant results are out fresh from the oven now and hence it is again time to re-look at the comparative analysis of the Top 5 Indian IT firms for the quarter ending 31’st December, 2012. I have updated the analysis that I had written earlier this quarter with the comparison of the key 4 Indian IT firms to now include COGNIZANT. I have marked the updated sections in PINK.

THE COMPARATIVE ANALYSIS

The global economy forecasts are not very positive for the first half of the calendar year 2013. The US economy with the “fiscal cliff” only fixed temporarily and with no imminent ‘surgical’ correction in sight due to the political compulsions does not augur well for the world’s economy. While the situation in US is not as bad as in Europe, the country seems to be making the same fiscal and monetary mistakes that the Euro zone did in the yester years.  The Euro Crisis does not seem to show signs of fading away into the oblivion atleast in the next 12-18 months. However the Asia Pacific, Middle East and Latin American regions seem to be doing well compared to the developed nations. Australia is growing very well backed by its strong Mining industry and the Middle East is also expected to grow at 4% in terms of GDP in CY 2013. Latin America is showing similar growth trend as well. India and China together with Indonesia and Malaysia will be engines of growth in Asia. On the whole the global GDP is expected to grow at 3.4% YoY in 2013 and this is a good sign when compared to the 3% YoY growth in 2012.

IT firms will have to ride on the wave of increased IT spending in the emerging markets and rely on the ‘cost take out’ initiatives in the developed markets where the IT budgets will remain more or less unchanged over the last year. The key strategy that IT firms need to adopt is cutting the spend on support and maintenance projects by leveraging efficiencies such as re-use, accelerators and platforms and using these ‘savings’ for funding the transformational projects.

Cognizant had been doing consistently well over the last few quarters and has been showing a steady high growth. However for the quarter ending 31’st December 2012, Cognizant grew QoQ only by 3% in terms of revenues compared to a good 5.4% growth in the preceding quarter. This indicates a marked slowdown in the performance of the firm whose aggressive low margin strategies seem to be taking a toll on its ability to deliver consistently. The operating profit as a % of revenues at around 18-19% remains almost constant over the quarters. It appears as if its bottom-line is also under pressure if the halting of salary hikes and promotions for its employees for this FY are an indication.

TCS QoQ growth of 3.3% for Q3, FY13 was in line with the guidance of 3% but is lower than the last quarter QoQ growth of 4.6%. The growth has indeed slowed down at TCS in Q3. However on the margin front TCS is able to maintain its margins very well between 27-28% for the last few quarters. On the other hand, Infosys has been seeing margin erosion from 28% a few quarters ago to 26% last quarter and 25% in Q3. They further expect this to go down to 24% in Q4. This is certainly a change in the strategic direction at Infosys which has moved away from the industry leading margins strategy to a re-investment strategy which is useful in the long run.

HCL has shown a QoQ growth of 3.6% in Q3, FY13 vis. a vis. 3.2% QoQ growth in Q2, FY13. Despite the challenges in the market and the bad economy, HCL is accelerating and does not show signs of slowing down. It is leveraging its strengths in Hi-tech, Engineering and R&D verticals and specifically in Infrastructure space to boost its market share.  The more interesting trend to note is that its operating profits have increased by a whopping 41.5% YoY in Q3, FY13 indicating that HCL is attempting to go up the value chain and improve its profitability.

Wipro has continued its trend of QoQ growth from Q2 and has posted a growth of 2.4% QoQ for the quarter ending December 31, 2012. The operating margins remains constant over the last several quarters at 20.8% but this does not mean much in today’s times when most IT companies manage to keep their operating margins intact by ‘adjusting’ the variable pay of their employees. However Wipro also seems to have bounced back as can be seen from its decent growth performance in the last 2 successive quarters after a few preceding quarters of de-growth.

Infosys has shown a QoQ growth rate of 4.2% for this quarter (Q3, FY13) which was much higher than that in the previous quarter (excl. Lodestone) and 6.3% growth QoQ (incl. Lodestone) in Q3, FY13. This has sent a clear signal to the market that Infosys has bounced back. Infosys had shown de-growth in Q4, FY12 and Q1, FY13. People in the market were keeping fingers crossed when  it showed 2.6% growth QoQ in Q2, FY13 and were cautiously optimistic as they were not sure if this was a flash in the pan or if this growth trend would continue in the future quarters. A consistent and increasing growth trend in Q3 (even excluding Lodestone) certainly is a feather in the cap.

The summary of the performance analysis for Infosys, TCS, Cognizant, Wipro and HCL for the quarter ending December 31’st, 2012 are as follows:

1.       Infosys  leads in terms of QoQ Revenue growth at 6.3% with HCL following at 3.6%, TCS at 3.3%, CTS at 3% and Wipro trailing at 2.4%
2.       CTS leads in YoY Revenue growth at 17.1%, with TCS following at 14%, HCL at 13% , Infosys at 5.8% and Wipro trailing at 4.8%
3.       HCL  leads in terms of QoQ Operating Profits growth at 6%, with TCS following at 5.4%, Infosys at 4%, Wipro at 2.9% and CTS trailing at 0.3%
4.       HCL leads in terms of YoY Operating Profits growth at 41.5% with CTS following at 15.6%, TCS at 6.3%, Wipro at 4.8% and Infosys trailing at -12.3%
5.       TCS leads in terms of Operating Profits as a % of revenues at 27.3% with Infosys closely following at 25.7%, Wipro at 20.8%, HCL at 19.8% and CTS trailing at 18.3%
6.       CTS leads in terms of SG&A expenses as a % of revenues 19.7%, with TCS following at 19.1%, with HCL following at 13.3% and Infosys trailing at 11.4%

Following is the chart showing the comparative analysis of these top firms on various financial parameters:

Q3, FY13
Parameter
Infosys
TCS
Wipro
HCL
CTS
Q3 Revenues(M USD)
1911
2948
1577.2
1154.3
1948.2
QoQ Growth
6.3%
3.3%
2.4%
3.6%
3.0%
YoY Growth
5.8%
14.0%
4.8%
13.0%
17.1%
Q3 Operating Profits(M USD)
491
804
328
229
356.2
QoQ Growth
4.0%
5.4%
2.9%
6.0%
0.3%
YoY Growth
-12.3%
6.3%
4.8%
41.5%
15.6%
As % of Revenues
25.7%
27.3%
20.8%
19.8%
18.3%
Q3 Net Profits(M USD)
434
652
NA*
177.5
278.8
QoQ Growth
0.7%
1.4%
NA*
9.6%
1.0%
YoY Growth
-5.2%
14.8%
NA*
59.1%
16.1%
As % of Revenues
22.7%
22.1%
NA*
15.4%
14.3%
SG&A Expenses
217
563
NA*
153
384
As % of Revenues
11.4%
19.1%
NA*
13.3%
19.7%

*Wipro does not give P&L for Global IT services separately. There is a single P&L for Wipro Limited
  

For a "Value Creation Quadrant" view which analyzes the Top 5 IT firms in terms of value creation please click here


Please do feel free to send in your valuable feedback/comments on my analysis…